RemOnline, support for local authorities on exposure to electromagnetic waves
How can we help local authorities to assess their exposure to electromagnetic waves and make it easier to manage projects with operators?
Faced with the rapid deployment of mobile phone masts, local authorities are having to deal with the concerns of the population. As interlocutors with operators, they must also be able to manage projects and benefit from technical information that is easy to understand.
A service dedicated to local authorities
The current state of your local authority's exposure to electromagnetic waves, based on pre-defined (and customisable) criteria.
A 3D visualisation tool accessible via a secure online platform.
An independent tool with objective information to help you manage projects with operators.
Simplified display of antennas and their DIM (Dossier Information Mairie).

Definition of the calculation model parameters
Input of 4 essential pieces of information:
- Land
- Buildings with roofs: recovery of the town's 3D digital data or, if necessary, import of data from IGN's BD Topo.
- Antennas: import data from CartoRadio (updated ANFR data) or retrieve the town's digital data.
- Town Hall Information Files (DIM) in digital format
Targeted display
Display of specific buildings (schools, hospitals, etc.)
The list of buildings to be taken into account will be provided by the local authority
Options
- Manual recalibration and repositioning of antennas
- Quarterly simulations of new DIMs (taking into account new files/ operator updates)
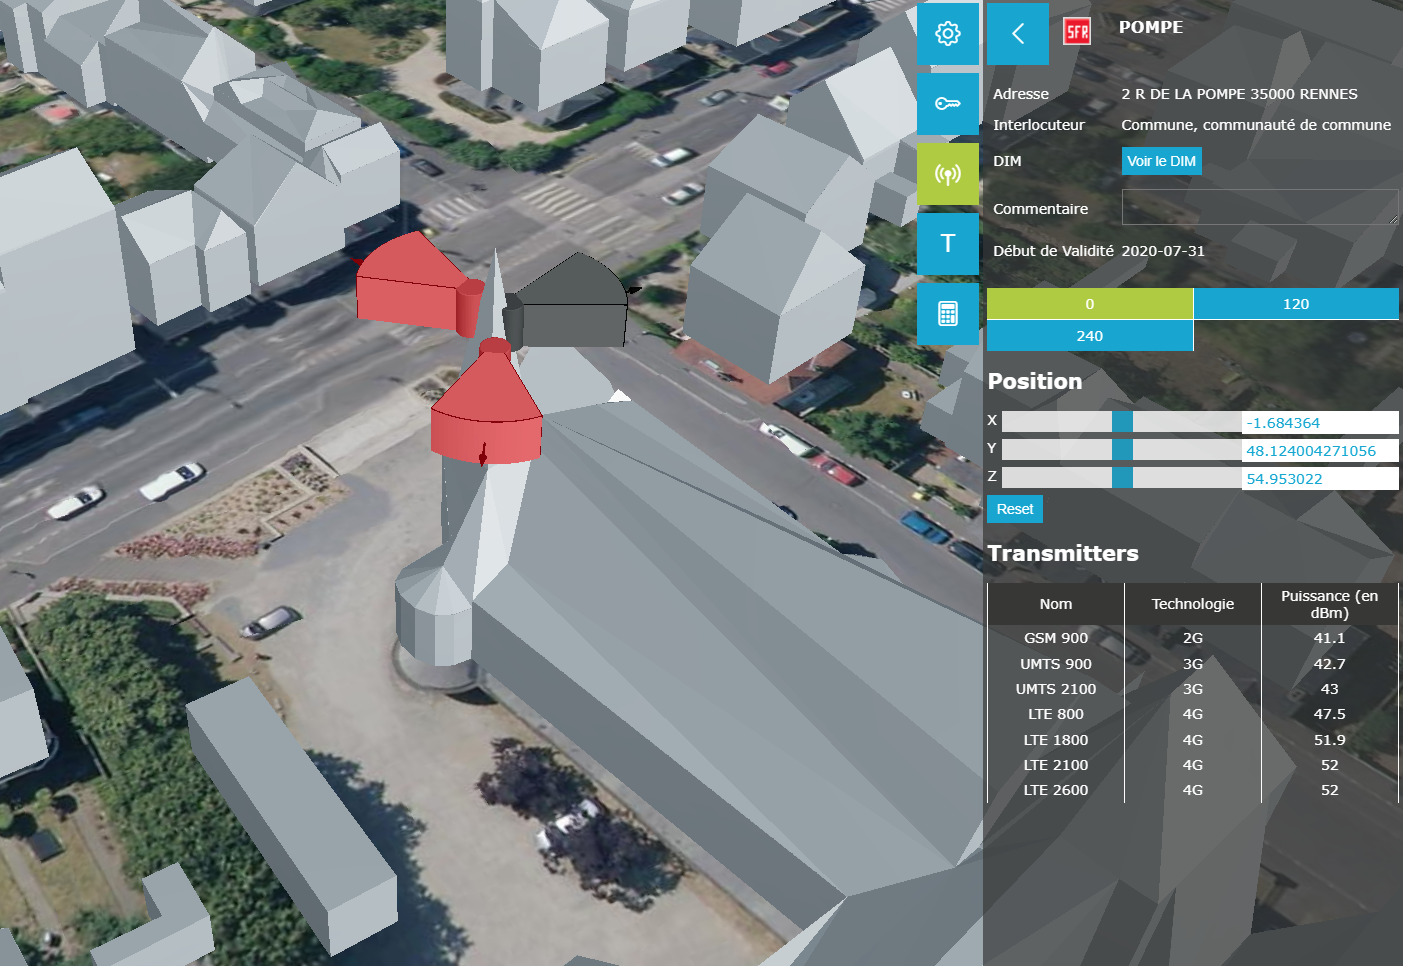
Display of the calculation of the propagation of electromagnetic waves
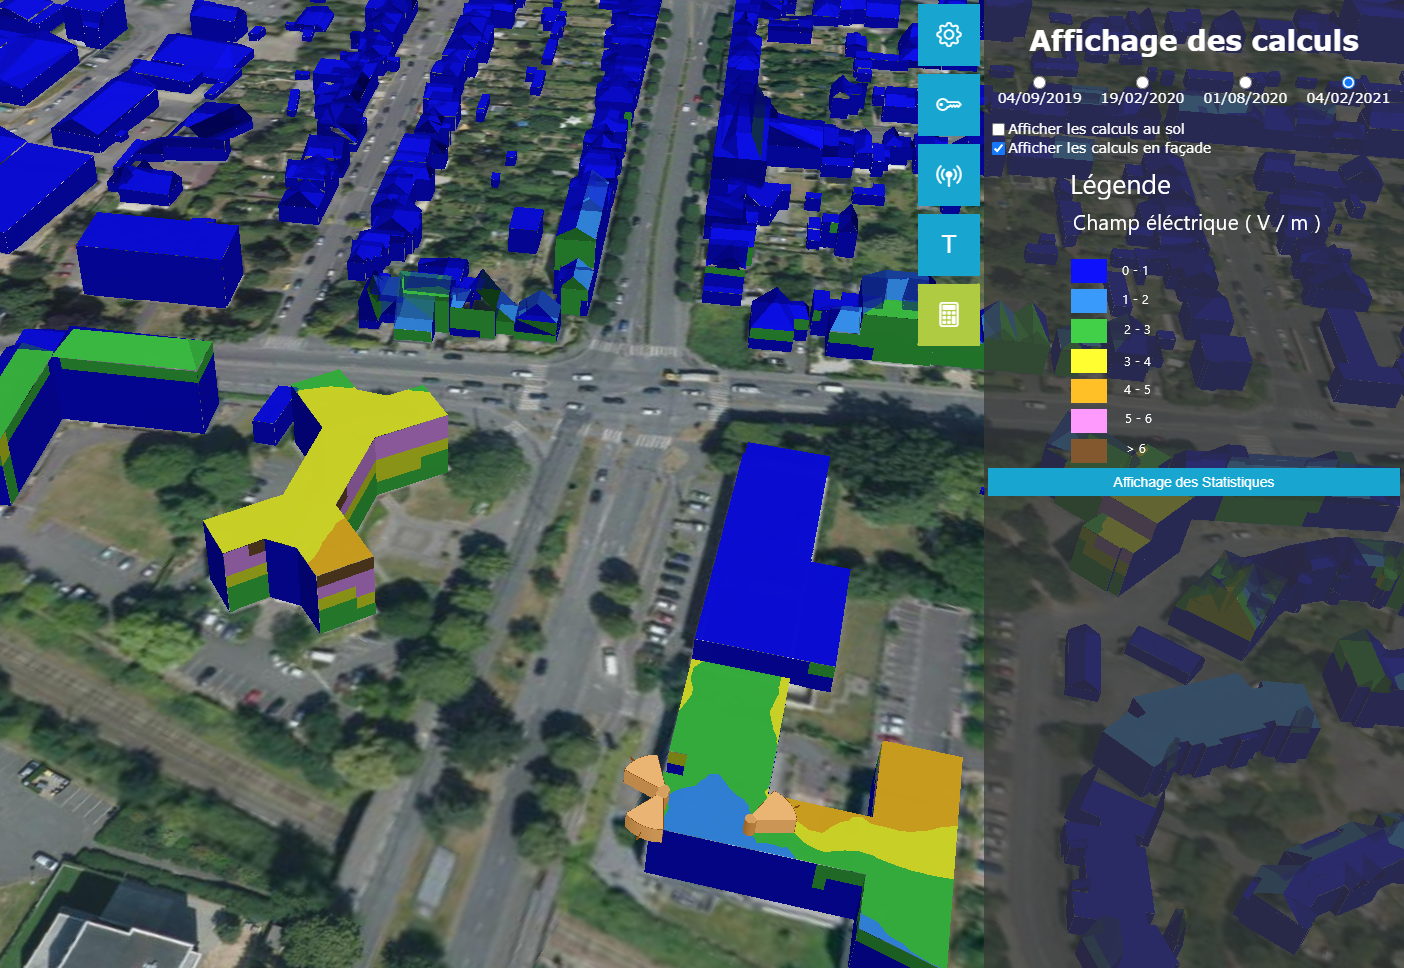
Map of interior building facades
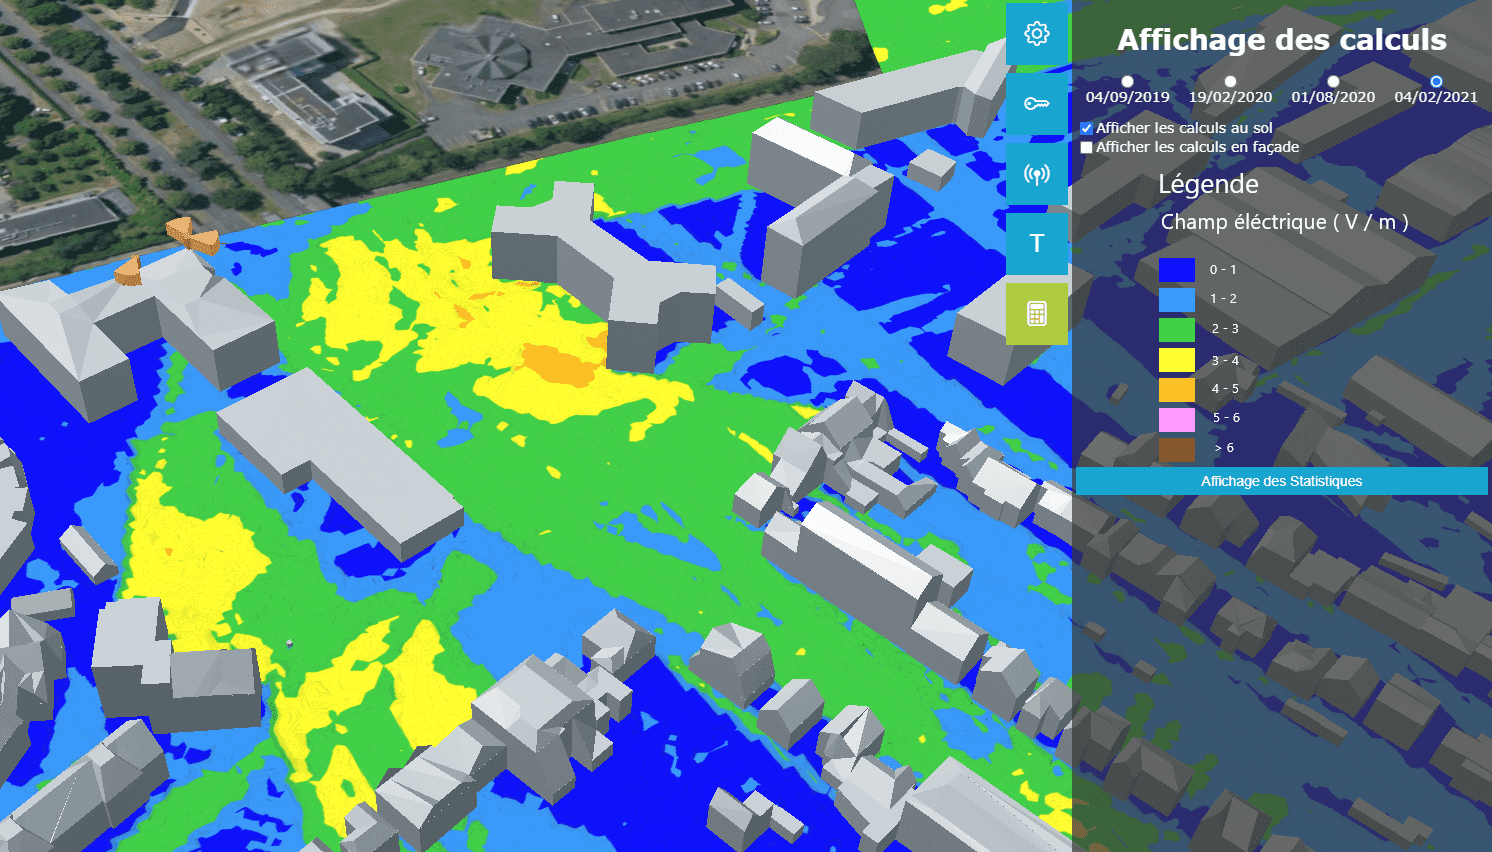
Horizontal map of exposure levels at 1.5 m above ground level in the city's streets and public spaces
Map of buildings in the city with colour-coded maximum exposure levels (facades of the most exposed buildings)
A customised service
- "Envelope" maps (facades + roofs)
- Calculation of the statistical distribution of the population by level of exposure over the whole town. Showing the affected population if this data is present in the input data (insee blocks).
- Display of calculation points
- Click on a point on the map: the corresponding contribution per antenna, per band and per operator is displayed in a table.
A summary report on the entire study in 3 parts:
- Description of methods
- Statistical results
- Exposure results
Interactive media:
3D Viewer: interactive 3D rendering accessible on the web via any browser (dedicated login and password). Interactive PDF file with the various options chosen.
Assistance in getting to grips with the tool and the interactive PDF: 1 hour of remote discussion (for a maximum of 2 people) when the deliverables are returned.
Technical support and advice to decipher/clarify operators' requests/needs.
Integrated service for the 1st year, then chargeable for subsequent years. A single email address: mithrarem@geomod.fr